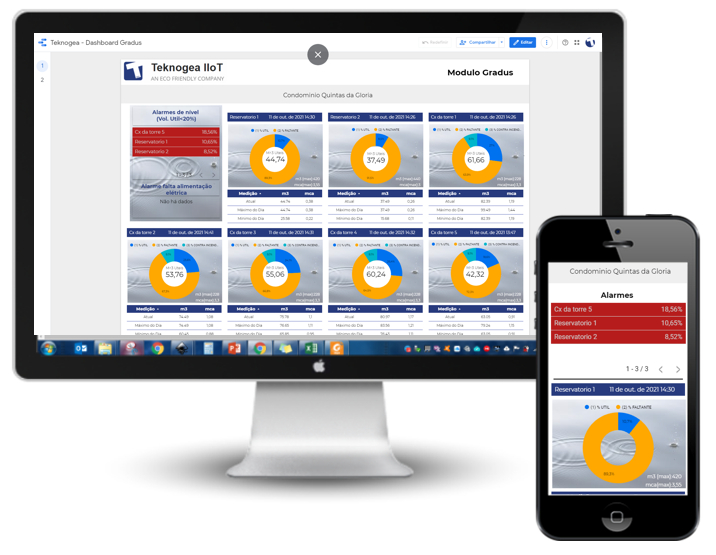
Pie chart with information level per reservoir
In an easy and intuitive way, the main screen of the system will show you the level data of the reservoirs or pressure of the networks, either in percentage or absolute form throughout the day.
Direct access by computer, tablet and cell phone.
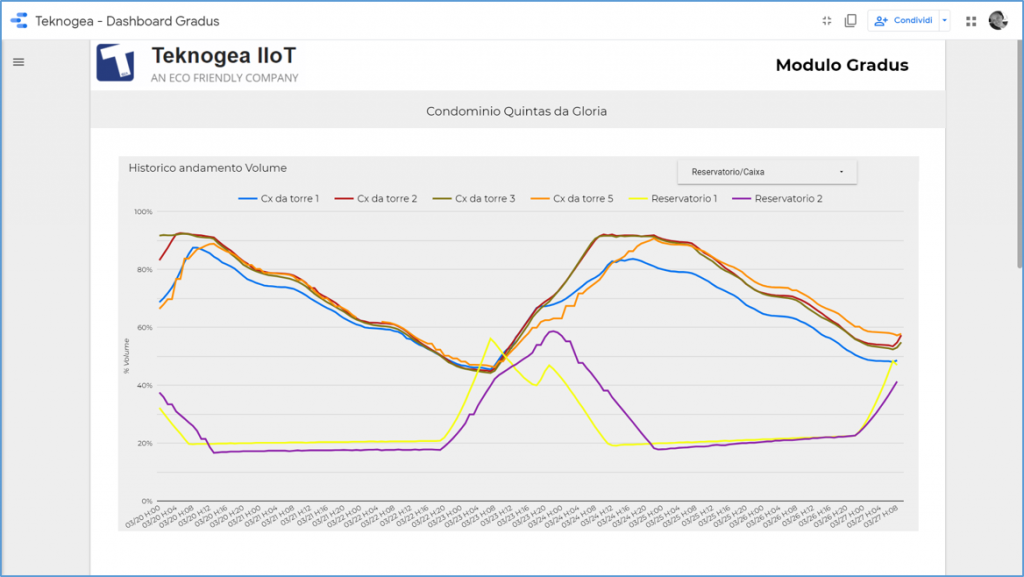
Historical chart
the level data of the reservoirs or pressure of the networks with the possibility of integrated analysis, allowing to instantly identify the times that the reservoirs are supplied by the concessionaire and when the pumping system is used to transfer water to the internal reservoirs.


Alerta
Email service
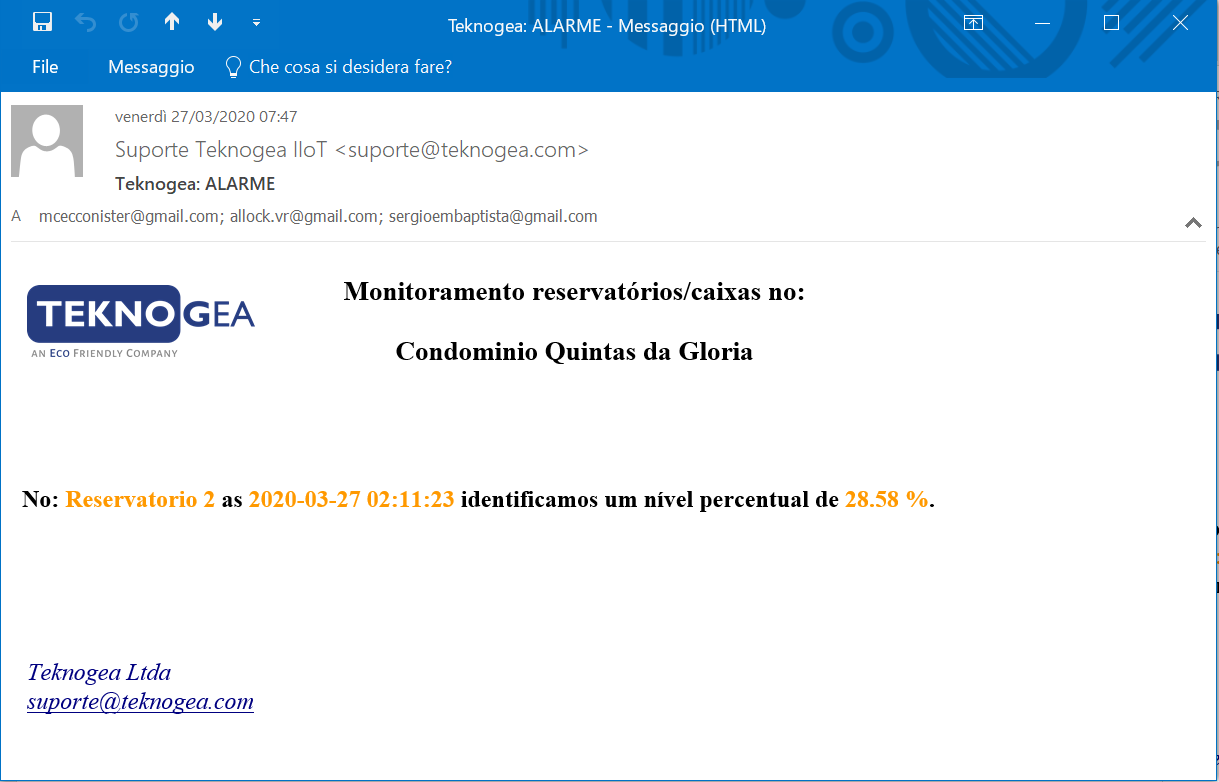
Our totally free mailing service will issue an alert in cases where the level of a reservoir or pressure in a network reaches the limit established by the user.
The email is sent in real time to one or more user-defined recipients.
